独立构建项目开发
# 前端插件开发
独立构建项目的话不限于用什么框架或原生开发,只需要将开发完成的项目进行打包后部署到生产环境即可。
# 开发静态页面
开发静态页面
新建一个简单的html项目
Index.html内容如下
<html lang="en">
    <head>
        <meta charset="UTF-8">
        <meta http-equiv="X-UA-Compatible" content="IE=edge">
        <meta name="viewport" content="width=device-width, initial-scale=1.0">
        <title>Document</title>
        <style type="text/css">
            #main {
                color: #ccc;
            }
        </style>
    </head>
    <body>
        <div id="main">
        </div>
    </body>
    <script>
        let xhr = new XMLHttpRequest();
        xhr.open('POST', '/IoT/api/v3/ZiChanService/GetZiChanListByPage');
        xhr.setRequestHeader("Content-type", "application/json; charset=utf-8");
        xhr.send(JSON.stringify({
            pageNo: 1,
            pageSize: 20,
            searchName: ''
        }));
        xhr.onreadystatechange = function(data, status) {
            if (xhr.readyState == 4 && xhr.status == 200) {
                document.getElementById('main').innerText = xhr.responseText;
            }
        }
    </script>
</html>
# 打包部署
打包部署步骤
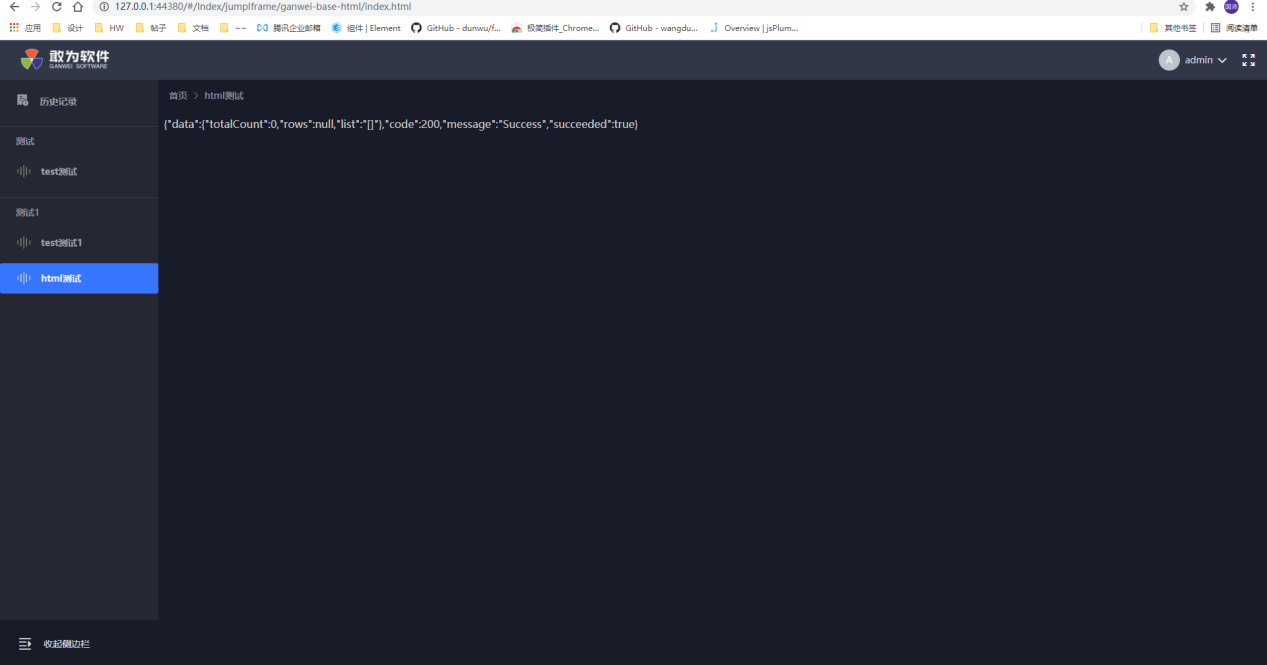
将打包好的html项目,拷贝到wwwroot文件夹,修改文件夹名为模块名称

配置数据库菜单表
INSERT INTO "main"."GWMenu" ("Id", "Code", "Name", "ParentId", "LinkUrls", "Route", "Level", "Path", "Icon", "NodeType", "Order", "MenuOwner", "Enabled", "MenuName") VALUES (11111, '', 'html测试', 11108, 21, '/Index/jumpIframe/ganwei-base-html/index.html', 2, 11106, 'iconfont iconshengyin', 2, 1, 0, '1', 'html测试');
- 页面访问结果

# 组件说明
# asideMenu 侧边菜单组件
asideMenu 侧边菜单组件
el-menu具体属性参考 (opens new window)
用法:
<template>
    <el-menu ref="menu" :router="true" :default-active="menuActive" @select="onRouters">
        <asideMenu v-for="item in menu" :data="item" :key="item.resourceId"></asideMenu>
    </el-menu>
</template>

<script>
import asideMenu from 'gw-base-components-plus/asideMenu/menu.vue';
export default {
    components: {
        asideMenu
    },
    data () {
        return {
            menu: []
        }
    }
}
</script>
asideMenu绑定data属性进行渲染。
数据结构:
// 菜单是菜单项数组
let menu: Array<MenuItem>;

// 菜单项数据结构
interface MenuItem {
    // 必需
    resourceId: number,         // ID
    parentRedId: number,        // 父级ID
    name: string,               // 菜单项名称
    children: Array<MenuItem>   // 子级菜单
    icon: string,               // 图标名
    nodeType: number,           // 菜单类型: 目录或菜单项
    route: string,              // 菜单项跳转路由
    // 可选
    resourceOrder?: number,
    className?: string,          // 菜单项样式类
    path?: string,
    menuOwner?: number,
    getPathList?: Array<string>
}
一般,目录下只有一个子菜单时只会渲染该目录(无下菜单拉项),目录无子菜单时该目录不会被渲染。
效果展示:

# echartList 图表组件
echartList 图表组件
- solid-bar 立体柱形图
- solid-circle 立体环形图
- solid-pie 立体扇形图
- historyechart
- barechart
# solid-bar 立体柱形图
solid-bar 立体柱形图
<template>
    <div class="test">
        <div class="title">立体图形--柱状图</div>
        <solidBar :seriesOptions="seriesOptions"
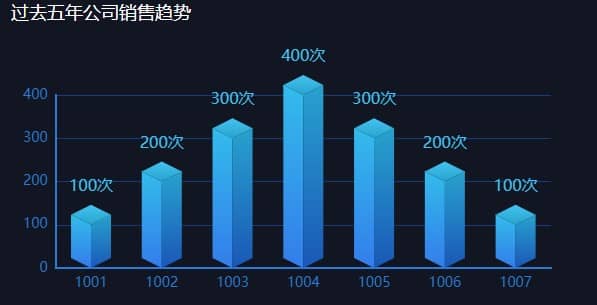
         :xData="barXdata" :yData="barYdata" name='过去五年公司销售趋势' unit="次" height="300px" width="600px" />
    </div>
</template>
<script>
import solidBar from 'gw-base-components-plus/echartList/solid-bar/index.vue'
export default {
    components: {
        solidBar
    },
    data () {
        return {
            barXdata: ['1001', '1002', '1003', '1004', '1005', '1006', '1007'],
            barYdata: [100, 200, 300, 400, 300, 200, 100],
            seriesOptions: {
                // color对象中每个属性对应长方体的三个面颜色
                color: {
                    CubeLeft: 'blue',
                    CubeRight: 'blue',
                    CubeTop: 'blue'
                },
                // 对应echart中 series-bar.label属性
                // https://echarts.apache.org/zh/option.html#series-bar.label
                label: {
                    normal: {
                        color: 'red'
                    }
                }
            },
            // 可重写除series属性外的配置
            layoutOptions: {
                legend: {
                    textStyle: {
                        color: 'red'
                    }
                }
            }
        }
    }
}
</script>
<style lang='scss'>
.test {
    width: 100%;
    height: 100%;
    padding: 0 20px;

    .title {
        width: 100%;
        height: 40px;
        line-height: 40px;
        color: white;
        background-color: #4e6ef2;
        border-radius: 8px;
        margin-bottom: 10px;
        margin-top: 20px;
        padding-left: 12px;
    }
}
</style>
注意
在layoutOptions属性中请不要配置series属性,否则会无法渲染数据
| 属性 | 类型 | 说明 |
|---|---|---|
| name | String | 图表名称 |
| xData | Array<number> | 横坐标数据 |
| yData | Array<number> | 纵坐标数据 |
| unit | String | 数据单位 |
| width | String | 图标宽度 |
| height | String | 图标高度 |
| showLegend | Bollean | 是否显示图例 |
| layoutOptions | Object | 除series属性配置 |
| seriesOptions | Object | series属性中数据项配置 |
效果展示

# solid-circle 立体环形图
solid-circle 立体环形图
<template>
    <div class="test">
        <div class="title">立体图形--环形图</div>
        <solidCircle :data="circleData" :showLegend="true" height="300px" width="600px" />
    </div>
</template>
<script>
import solidCircle from 'gw-base-components-plus/echartList/solid-circle/index.vue'
export default {
    components: {
        solidCircle
    },
    data () {
        return {
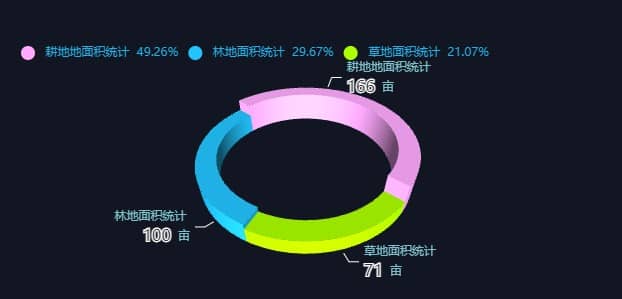
            circleData: [{
                name: '林地面积统计',
                value: 100,
                itemStyle: {
                    color: '#22c4ff',
                }
            }, {
                name: '草地面积统计',
                value: 71,
                itemStyle: {
                    color: '#aaff00'
                }
            }, {
                name: '耕地地面积统计',
                value: 166,
                itemStyle: {
                    color: '#ffaaff'
                }
            }],
            seriesOptions: {
                label: {
                    labelLine: {
                        lineStyle: {
                            color: 'white'
                        }
                    }
                }
            },
            layoutOptions: {
                legend: {
                    textStyle: {
                        color: '#1fb0e5'
                    }
                }
            }
        }
    }
}
</script>
<style lang='scss'>
.test {
    width: 100%;
    height: 100%;
    padding: 0 20px;
}
</style>
效果展示

# solid-pie 立体扇形图
solid-pie 立体扇形图
<template>
    <div class="test">
        <div class="title">立体图形--扇形图</div>
        <solidPie :data="circleData" :showLegend="true" height="300px" width="600px" />
    </div>
</template>
<script>
import solidPie from 'gw-base-components-plus/echartList/solid-pie/index.vue'
export default {
    components: {
        solidPie
    },
    data () {
        return {
            circleData: [{
                name: '林地面积统计',
                value: 100,
                itemStyle: {
                    color: '#22c4ff',
                }
            }, {
                name: '草地面积统计',
                value: 71,
                itemStyle: {
                    color: '#aaff00'
                }
            }, {
                name: '耕地地面积统计',
                value: 166,
                itemStyle: {
                    color: '#ffaaff'
                }
            }],
            seriesOptions: {
                label: {
                    labelLine: {
                        lineStyle: {
                            color: 'red'
                        }
                    }
                }
            },
            layoutOptions: {
                legend: {
                    textStyle: {
                        color: '#1fb0e5'
                    }
                }
            }
        }
    }
}
</script>
<style lang='scss'>
.test {
    width: 100%;
    height: 100%;
    padding: 0 20px;
}
</style>
效果展示
# curve 多曲线图表
curve 多曲线图表
<template>
    <div class="test">
        <div class="title">曲线图</div>
        <curve :seriesOptions="[{name: '遥测1', emphasis:{focus: 'series'}}, {name: '遥测2'}]"
        :showLegend="true" :xData="curveXData" :yData="curveYData" height="300px" width="600px" />
    </div>
</template>

<script>
import curve from 'gw-base-components-plus/echartList/curve/index.vue'

export default {
    components: {
        curve
    },
    data () {
        curveXData: [1, 2, 3, 4, 5, 6],
        curveYData: [[1, 2, 3, 4, 5, 6], [11, 12, 13, 14, 15, 16]],
        // 每条曲线的数据信息
        // https://echarts.apache.org/zh/option.html#series-line.type
        seriesOptions: [{
            name: '遥测1',
            emphasis: {
                focus: 'series'
            }
        },
        {
            name: '遥测2'
        }]
    },
    mounted() {
        // 实时更新数据
        // setInterval(() => {
        //     let last = this.curveXData[this.curveXData.length - 1];
        //     this.curveXData.shift();
        //     this.curveXData.push(last + 1);
        //     this.curveYData.forEach(item => {
        //         let last = item[item.length - 1];
        //         item.shift();
        //         item.push(last + 1);
        //     })
        // }, 1000);
    }
}
</script>
seriesOptions是一个数据对象,必须传入每条曲线对应的名称name属性以区分数据curveXData,curveYData数据修改后会被立即渲染,只需实时修改属性即可渲染实时数据
效果展示
# historyEchart
historyEchart
用法:
<template>
    <div class="content">
        <!-- 历史曲线  historyTime(Array):历史曲线时间; historyValue(Array):历史曲线值 status(bool), reflesh(bool):用于控制曲线重新加载的状态-->
        <HistoryEchart :historyTime="historyTime" :historyValue="historyValue" :status="hisEchartStatus" :reflesh='reflesh' />
    </div>
</template>

<script>
import HistoryEchart from 'gw-base-components-plus/echartList/historyEchart/historyEchart.vue';
export default {
    components: {
        HistoryEchart
    },
    data () {
        historyTime: [],
        historyValue: [],
        hisEchartStatus: false,
        reflesh: false
    },
    mounted () {
        // 切换主题
        window.onmessage = (event) => {
            if (event.data && event.data.theme) {
                this.reflesh = !this.reflesh;
            }
        }
    },
    methods: {
        getHistory() {
            // search API for history
            // this.historyTime = response.times;
            // this.historyValue = response.values;
            // this.hisEchartStatus = !this.hisEchartStatus;
        }
    }
}
</script>
# BarEchart
BarEchart
用法:
<template>
    <div>
        <!-- 历史曲线  status(bool):用于控制曲线重新加载的状态; echartData(Object):echartOption ,colorList(Array)颜色主题-->
        <BarEchart :status="loading" :echartData="echartData" :yUnit='yUnit' :colorList='colorList' :key='reflesh'/>
    </div>
</template>

<script>
import BarEchart from 'gw-base-components-plus/echartList/barEchart/barEchart.vue';
export default {
    components: {
        BarEchart
    },
    data () {
        echartData: {},
        loading: true,
        colorList: ['#00f0ff', '#008af5'],
        reflesh: false
    },
    mounted () {
        // 切换主题
        window.onmessage = (event) => {
            if (event.data && event.data.theme) {
                this.reflesh = !this.reflesh;
            }
        }
    },
    methods: {
        getHistory() {
            // search API for history
            // this.echartData = response.data;
            // this.loading = false;
        }
    }
}
</script>
# Loading 加载组件
Loading 加载组件
用法:
// main.js
import Vue from "vue";
import loading from "gw-base-components-plus/loading";
Vue.use(loading);
在入口文件中全局引入Loading组件
//xxx.vue
<template>
    <div v-loading="loading">
<template>
<script>
export default {
    data () {
        return {
            loading: false
        }
    },
    methods: {
        toogleLoading: {
            this.loading = false
        }
    }
}
</script>
通过控制loading指令绑定值来控制加载组件的展示。
效果展示:

# loadMore 下拉加载数据
loadMore 下拉加载数据
用法:
// main.js
import Vue from "vue";
import loadMore from "gw-base-components-plus/loadMore";
Vue.use(loadMore);
在入口文件中全局引入LoadMore组件
//xxx.vue
<template>
    <el-select v-model="value" filterable remote v-loadmore="loadMoreFun">
        <el-option v-for="item in options" :key="item.value" :label="item.label" :value="item.value">></el-option>
    </el-select>
<template>
<script>
export default {
    data () {
        return {
            value: '',
            options: []
        }
    },
    methods: {
        loadMoreFun () {
            // search API
            // this.options = this.options.contact(response)
        }
    }
}
</script>
通过v-loadmore动态加载大数据量的选择框选项
# Tree 树形组件
Tree 树形组件
el-tree具体属性参考 (opens new window)
用法
<template>
    <div>
        <myTree
        ref='myTree'
        :data="equipList"
        nodeKey="key"           // 节点惟一标志
        :props="defaultProps"     // 节点参数
        @current-change="getItem"     // 单个节点点击事件
        default-expand-all         // 是否默认展开所有父节点
        :height="100"             // 展示的高度,一般100% 必传
        show-count                // 是否显示分组中设备数量
        show-status              // 是否展示设备状态
        show-checkbox           // 是否展示选框(获取所选择的节点:this.$refs.myTree.getCheckedNodes())
        :showNumber='200'       // 最多展示多少个节点
        ></myTree>
    </div>
</template>

<script>
import myTree from 'gw-base-components/tree'

export default {
    data(){
        return:{
            defaultProps: {
                children: 'children',
                label: 'title',
                disabled: 'disabled',
            },
            equipList:[] //列表数组
        }
    }

    methods:{
        getItem(node){ //单个节点点击事件
            console.log(node)
        }
    }
}
</script>
模块中手动引入, 绑定data属性赋值,defaultProps用于映射属性使树状组件正常渲染。
注:
- equipList(Array):列表数组
- nodeKey(String):节点唯一 id(绑定的是树状结构每个节点的唯一值,一般为 id)
- props(Object):子节点字段名、节点展示名字段,默认
# Table 表格
Table 表格
用法:
<template>
    <gwTable
        :list='list'
        @add='add'               //新增按钮触发事件
        @delete='delete'         // 删除触发事件 接收参数:选中的列表数组
        @getList='searchChange'  //搜索触发事件 注意处理分页问题
        @handleSelectionChange='handleSelectionChange'   //当multiple多选时,选中触发,常用于批量操作,如批量修改
        :setttingList="setttingList"    //每一列中设置,包括列名、对应的属性名、宽度、最小宽度、是否hover显示全  example:[{label:'名字',property:'name',width:100,minWidth:100,showOverflowTooltip:true}]
        :noDataIconfont='noDataIconfont'   //当表格没有数据时展示的图标
        show-header     // 展示顶部 默认false
        multiple        // 多选
    >
</template>

<script type="text/javascript">
import gwTable from 'gw-base-components/gwTable/gwTable'
export default {
    components:{
        gwTable
    },
    data(){
        return{
            list:[], //接口中的数据
            pagination:{     //分页
            pageSize:25,  // 分页大小,一页显示多少个
            pageNo:1,     // 当前页
            total:0
            },
            setttingList:[
                {
                    label: '名称',       //展示的表头名
                    property: 'name',    // 对应的属性名
                    width: 200,          //宽度
                    showOverflowTooltip: true  //是否hover弹窗显示
                },
                {
                    label: '描述',
                    property: 'description',
                    width: 500
                },
                {
                    label: '服务',
                    property: 'services',
                    showOverflowTooltip: true
                }
            ],
            noDataIconfont:''
        }
    }
    methods:{
            add(){}
            delete(arr){}
            searchChange(val){
            this.pagination.pageNo=1;
            this.pagination.total=0;
            this.getList(val)
            },
            handleSelectionChange(arr){},
            getList(val){
                // api请求列表,记得加val参数
            }
    }
}

</script>
参数说明
<!-- show-header(bool) //展示顶部,包含搜索框、操作按钮,不传默认false    multiple(bool):是否多选-->

 //支持自定义渲染
 <template v-slot:header></template> //顶部输入框、操作按钮自定义渲染
 <template v-slot:headerSearch></template> //顶部输入框自定义
 <template v-slot:headerOperate></template> //顶部操作按钮自定义
 <template v-slot:table></template> //表格自定义渲染
 <template v-slot:tableOparate></template> //表格自定义操作按钮,默认无


//example:如果表格按钮有操作功能,如查看详情
 <template v-slot:tableOparate>
   <el-table-column label="操作" width="100">
        <template slot-scope="scope">
            <el-button @click="myClick" type="text" size="small">
               查看详情
           </el-button>
       </template>
   </el-table-column>
 </template>

</gwTable>
上次更新: 2024/10/9 09:29:39
